Applications
Five applications. One platform.
Same signals, same time base, same interface. Each application below was built on real machines in our laboratory — with the result it reached and the conditions it reached it under.
Application 01
Machine fleet & OEE
Every machine, live — and honest numbers.
One view of the whole machine park: what is running, what is down and why. Machines without an interface get their state from a retrofitted sensor — and where something is not measured, the screen says so instead of showing 0 %.
The fleet view and the shift reports run on the machines in our laboratory every day — three controller families and one machine with no controller at all.
- Status from the controller — or derived from a sensor, and labelled as derived
- Alarms in plain text, word for word as the controller reports them
- Parts and OEE per machine, timeline of every minute, downtime sorted by duration
- Not measured means “not computable” — never a made-up 0 or 100
Application 02
Recording on one time axis
Every source in sync — and the program says where it is.
A turning test on our Swiss-type lathe: a sensor on the spindle drive, speed, feed and override from the controller, and the messages of the NC program itself — all on one time axis.
Because the NC program reports its own sections — start, plunge, turn, retract, cut-off — every pass is found exactly, with its true start and end — nothing has to be guessed.
- Sensor and controller data in sync, on one shared clock
- Messages from the NC program mark every phase of the cycle
- Every pass detected exactly — start and end from the program itself
- Automatic recording: the box captures the right moment by itself
Application 03
Process anomaly
See the deviation while the part is still in the machine.
When a built-up edge forms and breaks off, the cutting force jumps — and the drive draws more current. The question was: does the spindle current see it, during machining, without a new sensor at the tool?
The built-up edge in turning
Twelve parts, six passes each, one cutting edge, one cutting condition. After every part the edge went under the microscope. The score appears about one second after the pass — computed from the current the drive draws anyway.
- Signal: spindle drive current — no sensor in the work area
- Result about one second after the end of the pass
- All three parts with a built-up edge flagged; the clean ones stayed quiet
Lab result
3 of 3
built-up edges detected · 0 false alarms
Lab, Hanwha XD38II: 12 parts × 6 passes, one edge, one cutting condition; 9 parts rated by microscope photo.
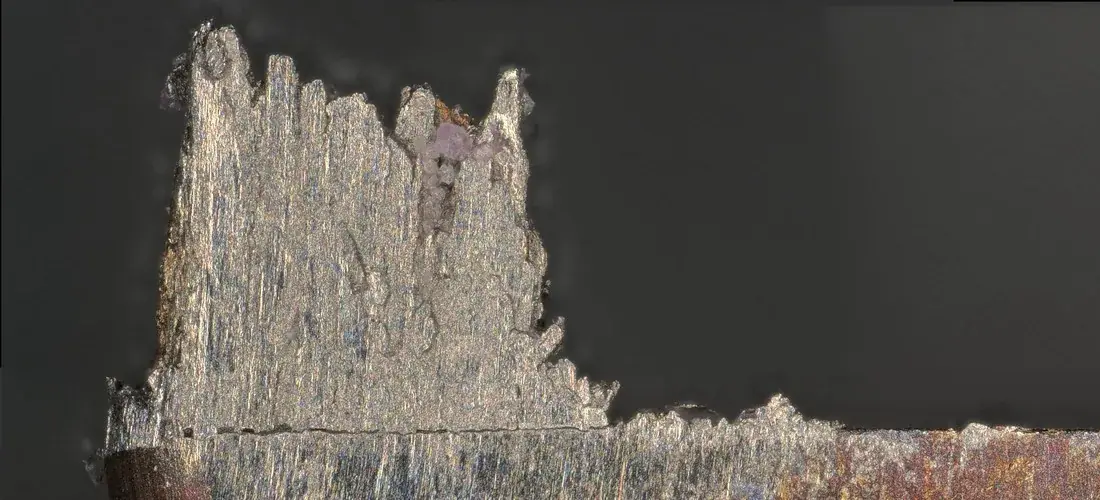 Part 2-3 · built-up edge
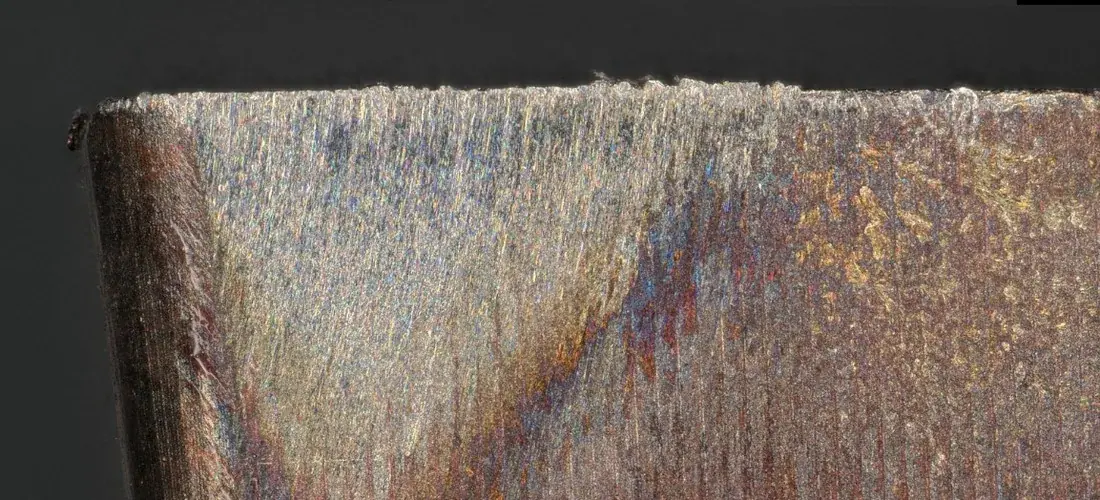 Part 2-5 · clean
In the product: every run against the good runs
The built-up edge is one score. In the product this is more general: every program run is recorded automatically and compared with the good runs of the same program on the same machine — normal, watch or anomaly, and where in the program it was different.
- No quality measurement, no prior rating of parts, no training — the machine is its own reference
- Reliable from about eight reference runs on
- Meant for series programs, not one-off parts
- The system shows a deviation — whether the part is bad, a person decides
Application 04
Quality prediction
The roughness after every pass — and the tool's condition from one part.
In grinding, thousands of grains work at once and change with every pass; in turning, the edge wears from part to part. Both times the question is the same: what state is the process in — right now, without stopping to measure?
Grinding: roughness after every pass
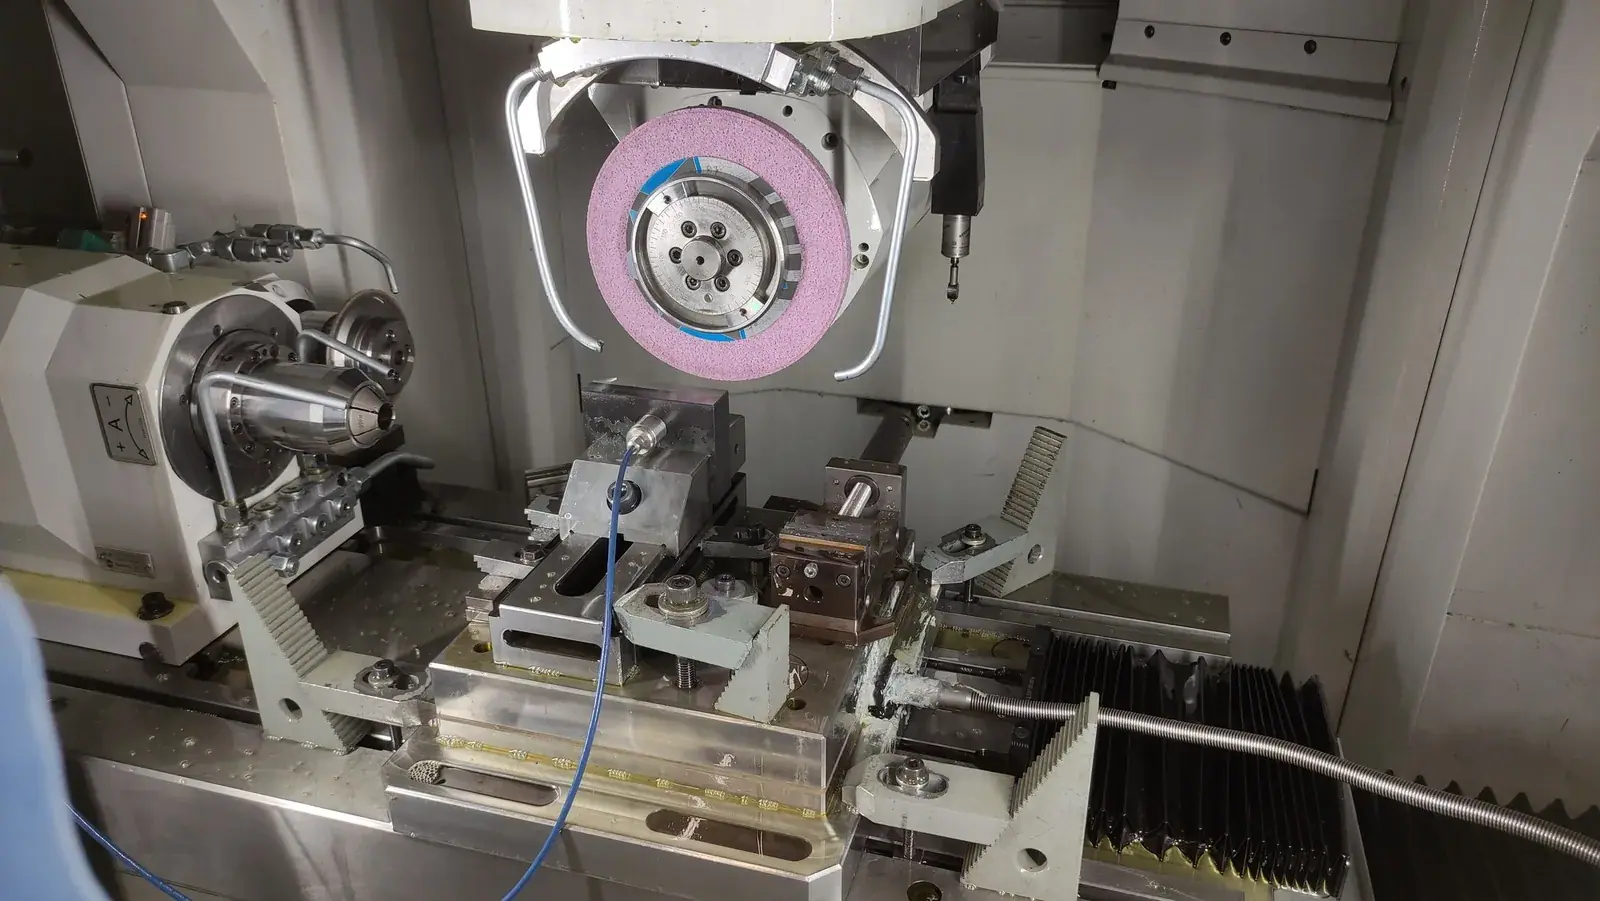
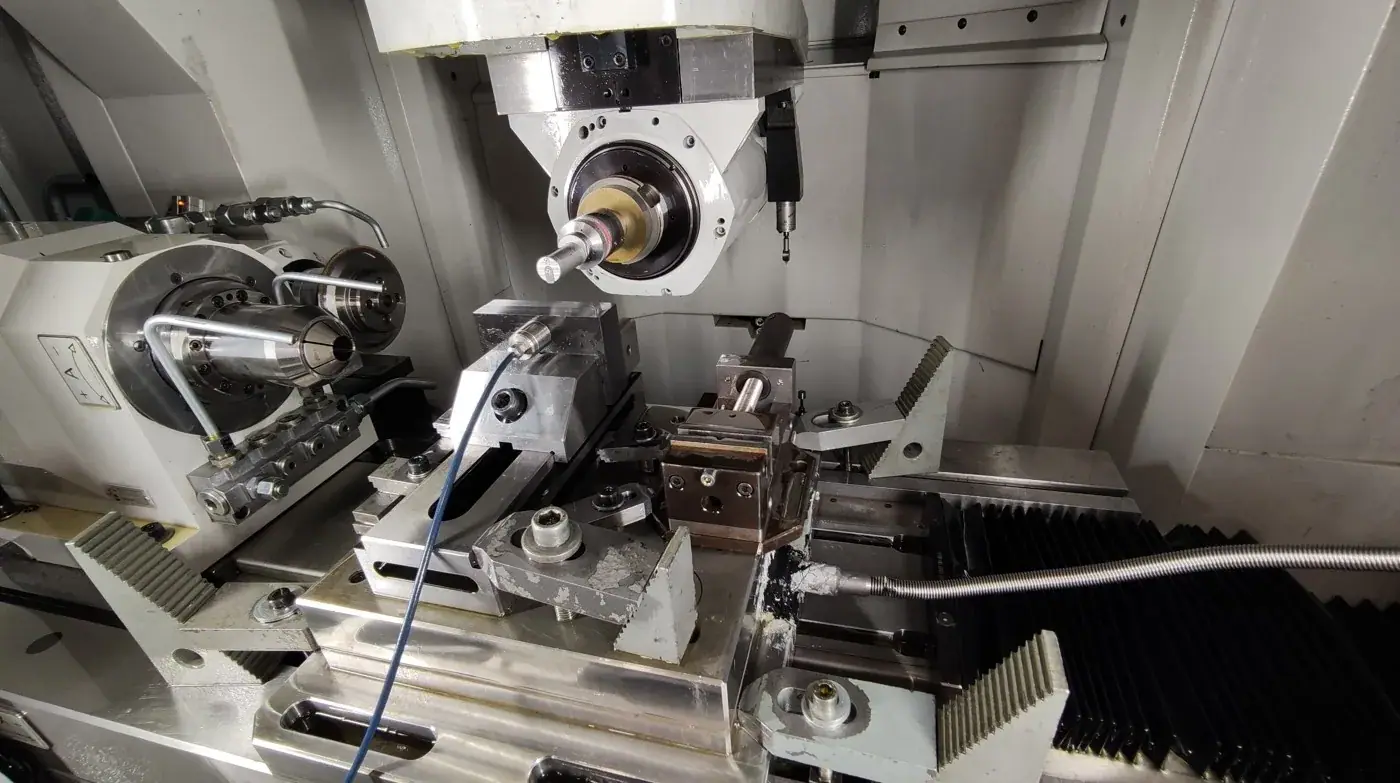
On our five-axis tool grinder, sensors at the machine show how sharp the wheel is — evaluated only while it is really cutting. From that state the system estimates the roughness after every pass. The operator measures now and then; every measurement resets the estimate.
- A recommendation after every pass: normal, measure or dress
- The operator sets the limit — nothing is written to the machine
- Asks for a measurement when it is unsure, instead of guessing
Lab result
13 nm
mean deviation of the roughness estimate (Ra)
Lab, A.Haas Multigrind CB: test during operation over 121 passes after dressing, 6 measurements requested by the system; the model had not seen this test.
Turning: tool condition from a single part
Is the edge still new — or already worn? From one single part, with no history and no part counter: like a Monday morning, the system only knows the part that just ran. The signal is the spindle current during external turning.
- Strict test: each measuring day predicted by a model that never saw that day
- The two misses sit exactly at the wear limit
- The first part of every day was recognised correctly
- One edge, one program — the pilot tests several edges in production
Lab result
73 of 75
parts classified correctly (97 %)
Lab, Hanwha XD38II: one edge, one program, wear limit VBmax 120 µm, 5 measuring days; does not predict sudden chipping.
Application 05
Assistant
Questions in everyday language — answered in your plant.
Which alarms cost the most time? Why was utilisation low yesterday? What does the manual say about this alarm? The assistant answers on every page — with a language model that runs on your own hardware.
The assistant does not answer from memory. It reads the same data as the dashboard, with the permissions of the person asking — and says so when it cannot answer something.
- Runs in your plant — no cloud
- Reads alarms, downtime, utilisation and the timeline like the dashboard does
- Manuals, textbooks and work instructions — per machine or for all
- Answers with sources, and names what is missing
One set of hardware
All five run on the same two boxes.
The EdgeBox captures, the AI box computes — in the control cabinet, next to the machine.
See the hardware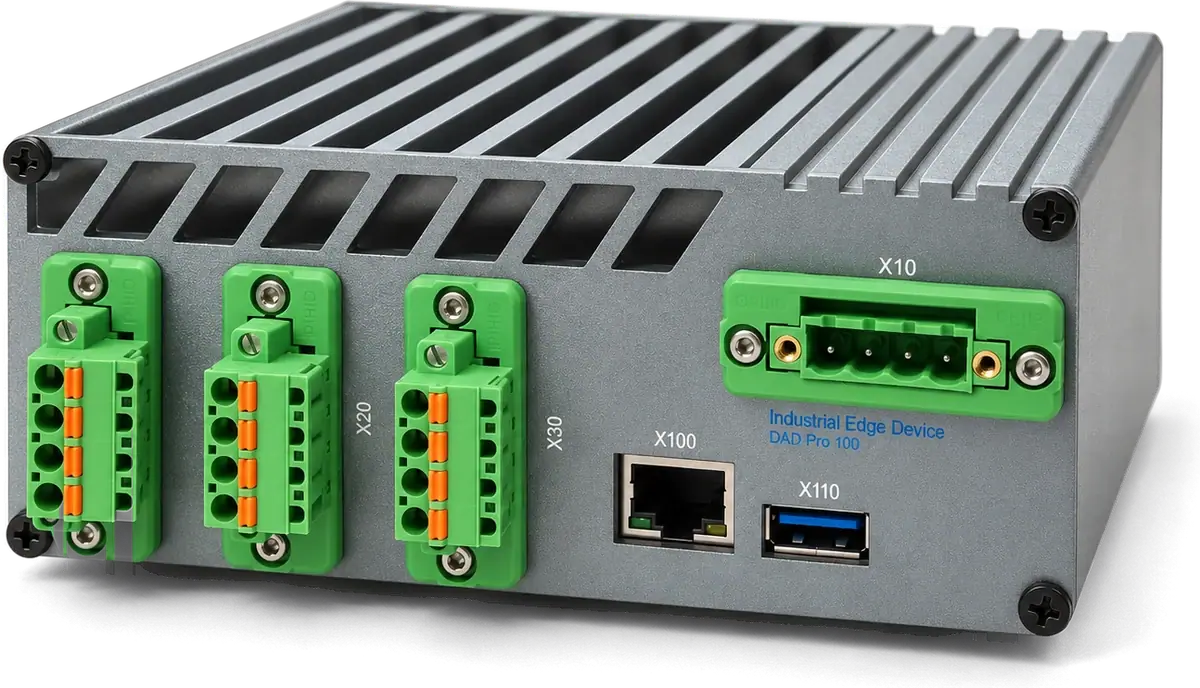
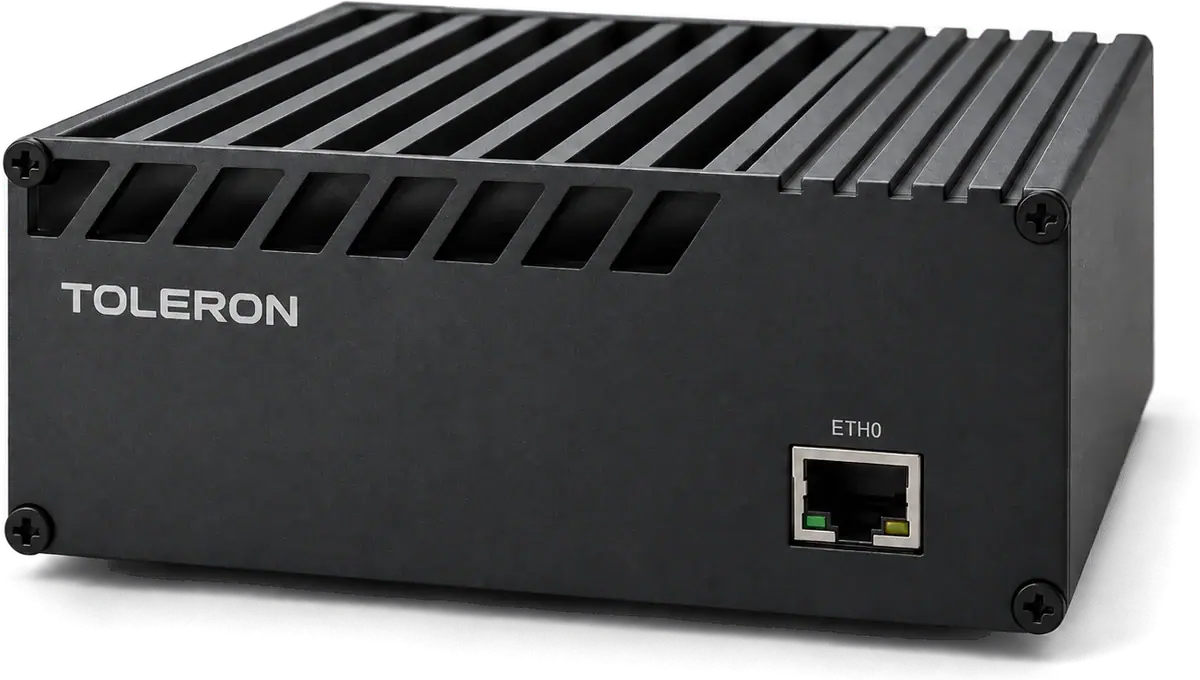
In the pilot
You start with one application — on your machines.
Whether the models hold up, only a real factory will show. That is why every pilot begins with one clearly scoped application and an honest final report.
Alarm analysis
No hardware at the machine — the fastest result.
Process anomaly
Series programs, no prior rating of parts — e.g. the built-up edge.
Tool or wheel condition
The highest value — and the longest path.
Assistant
Questions to your own data, answered locally.
Every result on this page comes from our own laboratory at the KSF in Tuttlingen: one machine, one tool or wheel, defined conditions. Whether it holds in your production is exactly what a pilot finds out.
Talk about a pilotNext step
Bring intelligence to your machines.
Connect existing CNC equipment without replacing the machine or the controller. We start with one machine, real data and an honest acceptance run.